


A clip of Katie Porter waving a chart at a congressional hearing from September 22nd went viral on Twitter this week as ‘proof’ that corporate greed was responsible for inflation.
‘Boom!’, the narrative goes, ‘The high prices your family is paying has nothing to do with Joe Biden or the Democrats. It’s those greedy corporations!’
Democrats are getting the sense that Biden’s poor handling of the economy is about to bite Democrats in the backside at the polls this November. They NEED to shift the blame.
Bigger corporate profits account for *over half* of the higher prices people are paying. pic.twitter.com/RZr5O0X4oJ
— Rep. Katie Porter (@RepKatiePorter) October 18, 2022
It looks bad, right? The problem is that Porter’s chart doesn’t seem to add up. Some of you disagreed with her characterization.
https://twitter.com/bonchieredstate/status/1582705549065363456?s=20&t=TWLiRf-uvK3j_dCnvl8n9Q
These comments stem from a misunderstanding of basic economics. Inflation is a monetary phenomenon. When money supply goes way up — like it has — too many dollars chase too few goods. Thus, corporation face a different demand curve and equilibrium price goes up. #basiceconomics
— Mark Buffington (@MarkBuffBIP) October 18, 2022
https://twitter.com/brad_polumbo/status/1582735603627851776?s=20&t=TWLiRf-uvK3j_dCnvl8n9Q
In the video clip above, there’s a moment where Porter points at the light blue portion of the chart and the witness, Mike Konczal, responds ‘11.5%’. Porter then says ‘and what is it today?’, to which he replies ‘53%’.

The average cost of an item from 1979 – 2010 had 11.4% profit baked in. From 2010 – 2020 its now 54%. This is why your groceries cost 3 – 4x as much as they did. https://t.co/6DOTjWfguk
— Sekh (@SekhBurd) October 19, 2022
That’s what Ms. Porter’s telling people, and that’s what most of them are hearing. That was the goal, but it’s not accurate.
We’re guessing Katie Porter doesn’t exactly understand her chart either.
The light blue portion of Porter’s chart says that the average contribution of profits to unit price from 1979 to 2019 is 11.4%.
The dark blue portion of Porter’s chart say the growth in the contribution of profits for a handful of quarters starting in the 2nd quarter of 2020 is 53.9%.
She’s comparing apples to oranges.
I think there are lies, damn lies, and statistics. To take the period of 1979 through 2019 and try to compare it to a short period of time of of 6 quarters is not relevant. You need to look at the trajectory of corporate profits over that entire time frame as well.
— Jeff Thomas, Host of Investment Masterminds (@InvMasterminds) October 20, 2022
Here’s what Katie Porter’s chart would look like if it compared apples to apples (comparing averages of both periods):

Not nearly as exciting, eh?
It still shows an increase in profit while the other contributors to the unit price are shrinking, but it sure doesn’t give the shock value Katie wanted.
The original chart comes from an article by Josh Bivens with the Economic Policy Institute (EPI), a left-leaning think tank. You can read the article here.
When Mr. Bivens first released the article in May, he followed up on Twitter, explaining why he chose the 2nd quarter of 2020 as the starting point. It’s a good question, right?
In a recent blogpost I did on unit profits’ contribution to price-growth over the recovery, I used 2020q2 as a starting point – chose it mostly because it’s the NBER-identified trough. Starting from there, though, doesn’t make the profit contribution an outlier. 1
— Josh Bivens (@joshbivens_DC) May 17, 2022
He stands by his conclusion, but look at his own data, plotted using the same calculation with different starting points (and the 11.4% average to the left being compared to growth numbers again).
The chart below shows the long-run average contribution of profits to prices, and, its contribution between the date shown on the bar and 2021q4. 3 pic.twitter.com/UFu8MOL1GY
— Josh Bivens (@joshbivens_DC) May 17, 2022
It bounces around quite a bit and shows a decline in growth in profit contribution over the handful of quarters coming out of the initial 6 months of the pandemic.
The pandemic was an economic aberration and it's folly to compare one year of shutdown to a 41-year average.
— Dave Van de Walle (@Area224) October 22, 2022
Bingo.
There was a 10.3% increase in unemployment in April of that period (20+ million jobs) due to lockdowns while the government was also handing out $1,200 stimulus checks. Surely economists can come up with some reasons why there was a growth in profits during a period of such high uncertainty that doesn’t simply amount to ‘companies suddenly became greedy in 2020’?
Should have noted that descriptive data cant be used to reliably make causal inferences.
— Matt Darling 🌐🏗️ (@besttrousers) October 19, 2022
Corporate greed is bad. And we should all be skeptical of big corporations. However, this is a completely disjointed conversation that confuses causation vs correlation (extremely basic). Also, the dude you are talking to is a political operative…so, that info may be useful
— Dr. Credentialed Expert (@SteveKSCCHS) October 19, 2022
I’ll take cherry picking my data for $200 Alex. Those same companies also lost billions during the pandemic. Why do we have inflation. Econ101. Too many dollars chasing to few goods.
— Man Up a Spiritual Oasis for Men (@ManUpSugarland) October 19, 2022
Yes, too many dollars chasing too few goods. Is it any wonder people spending stimulus money on limited goods resulted in companies earning higher profits for a time and then eventually led to inflation?
It’s not hard to find economists agreeing that greed is not the reason for the inflation we’re seeing now. Even Janet Yellen wasn’t on board with the idea that corporate greed is driving inflation.
What did Joe Biden and Democrats do when they took office: Voted in another $1.9 trillion in ‘COVID relief’.
They made it worse and now they’re looking for cover.
You can't have a crippled economy for 18 months, print $7trillion in new money, and not have serious consequences. As opposed to targeted liquidity, the administration decided to attempt a mass redistribution, and that money drove consumers to continue to spending beyond means.
— Jeff Thomas, Host of Investment Masterminds (@InvMasterminds) October 20, 2022
So where does that leave us? Democrats need someone to blame other than Washington D.C. printing money. It’s easy to blame the nameless face of ‘greedy corporations’.
Katie Porter stepped up and provided a misleading chart to help them do just that.
We expect you’ll be seeing more of Katie’s chart going forward.
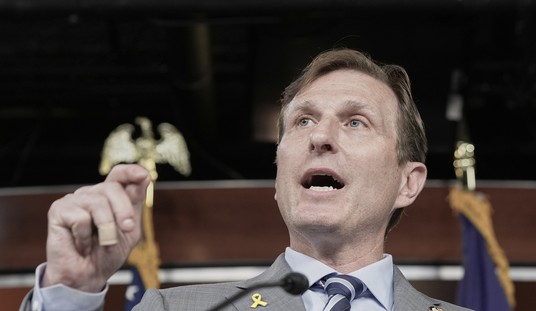
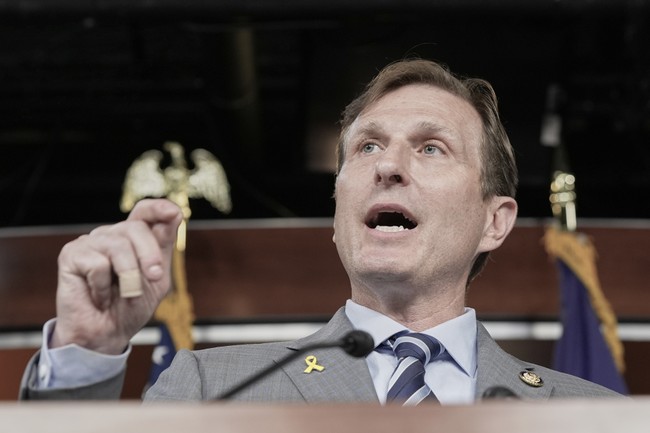
Do yourselves a favor and watch the comments from Congressman Byron Donalds from the same hearing where Porter presented her chart.


Join the conversation as a VIP Member